Analysing Drug Response in 3D Spheroid Culture Models
Spheroid models used in drug screens offer the benefit of a physiologically relevant biological model to allow for screening of cancer killing therapeutics or drugs toxicity to host cells. Spheroid culture systems are easy to use, modifiable, adaptable to standards of drug screening processes and easily reproducible, making it the preferred method of choice for high throughput/content drug screens. A variety of methods are then employed to measure cell viability of spheroid models and its response to therapeutics, in order to conduct drug screens in a controlled, comprehensive, standardized manner (1-3).
Analytical tools employed to asses drug response: Cell shape and size
Cytotoxicity is among the principle parameter of drug effects. Unlike cells grown in monolayer form, spheroids contain larger size and shape which can be an important determinant of cytotoxicity over long periods.
Additionally in the context of complex cellular processes such as tumour invasion and angiogenesis can easily be replicated within spheroid systems, and effect of therapeutics on these processes can be assessed with simply bright field microscopy (1-3).
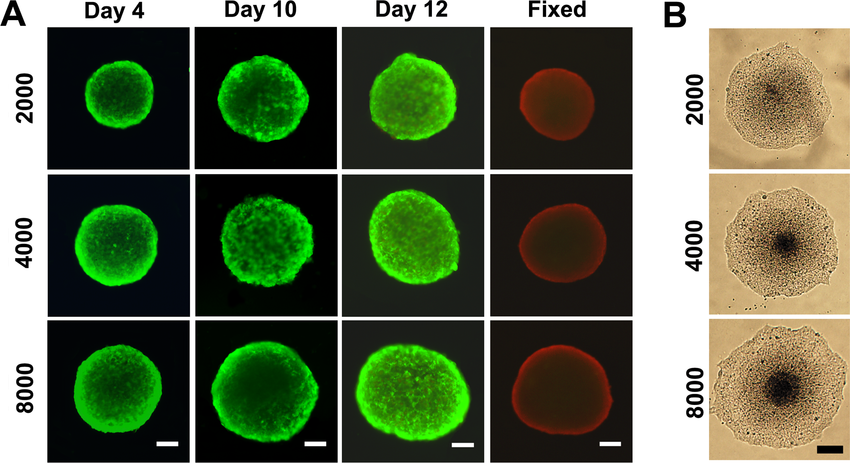
Fluorescence microscopy
Additionally effect of therapeutics on spheroid cell composition, localisation and function can also be studied via fluorescence microscopy, with immunofluorescence staining or expression of fluorescent proteins or probes. Of these, the use of fluorescent probes is popular as it does not allow for fixation of spheroid culture and can be adapted for a variety of cell lines. Some of the fluroescent probes commonly utilised in spheroid studies include nuclei staining with Hoechst 33342, Calcein-AM/Ethidium homodimer 1, DiOC18(3) to measure cell viability. Cytotoxicity assays includes probes such as propidium iodide, SYTOX green, CellTox Green and Dihydroethidium (4). These probes along with many others are commonly used in drug screens to asses:
- cell tracking
- Cell function
- Reactive oxygen species (ROS) production
- Mitochondrial activity
- Other physiological parameters such as oxygen and nutrient gradients (4) .
One of the major limitations of using fluorescent probes is the uneven rate or decreased rate of dye transfer within the spheroid. Compared with traditional monolayer models, within spheroids, dye gradients are produced due to its compact size and shape thus taking longer to reach staining equilibrium. Uptake of dye also depends on its structure, spheroid type, and spheroid health. Therefore most staining methods are used to asses phenotypic changes to effect of drugs in a spheroid state (5-6).
Metabolic assays
Standard metabolic assays are also applied to assess cell viability in response to drugs. These include MTT tetrazolium reduction, acid phosphatase assay, use of colorimetry, fluorescence assay, and chemiluminesense assays (ATP assay) (4). At present the most robust metabolic assay is the measurement of ATP via chemiluminescence. Chemiluminescence ATP assays is high sensitive, and the ATP content within a single spheroid can be reliably measured within the same U bottom plate, following phenotypic analysis. ATP assays are in this regard, low tech, highly sensitive and reliable method of assessing cell viability as well cell response to potential therapeutics (2).
Spheroid size and shape still remains a reliable parameter for real time monitoring go drug effects. Fluorescent probes however offers additional understanding of mechanism of action of the drugs. However albeit more probes may give more information, they must not affect spheroid growth, or interfere with cellular response to drugs.
References
- Vinci M, Gowan S, Boxall F, Patterson L, Zimmermann M, Court W, et al. Advances in establishment and analysis of three-dimensional tumor spheroid-based functional assays for target validation and drug evaluation. BMC Biol (2012) 10:29.
- Baek N, Seo OW, Kim M, Hulme J, An SS. Monitoring the effects of doxorubicin on 3D-spheroid tumor cells in real-time. Onco Targets Ther (2016) 9:7207–18.
- Zanoni M, Piccinini F, Arienti C, Zamagni A, Santi S, Polico R, et al. 3D tumor spheroid models for in vitro therapeutic screening: a systematic approach to enhance the biological relevance of data obtained. Sci Rep (2016) 6:19103.
- Mittler F, Obeïd P, Rulina AV, Haguet V, Gidrol X and Balakirev MY (2017) High-Content Monitoring of Drug Effects in a 3D Spheroid Model. Front. Oncol. 7:293.
- Martinez NJ, Titus SA, Wagner AK, Simeonov A. High-throughput fluorescence imaging approaches for drug discovery using in vitro and in vivo three-dimensional models. Expert Opin Drug Discov (2015) 10(12):1347–61.
- Kijanska M, Kelm J. In vitro 3D spheroids and microtissues: ATP-based cell viability and toxicity assays. In: Sittampalam GS, Coussens NP, Brimacombe K, editors. Assay Guidance Manual. Bethesda, MD: Eli Lilly & Company and the National Center for Advancing Translational Sciences (2016). p. 1–16.
- Gong, Xue & lin, chao & Cheng, Jian & Su, Jiansheng & Zhao, Hang & Liu, Tianlin & Wen, Xuejun & Zhao, Peng. (2015). Generation of Multicellular Tumor Spheroids with Microwell-Based Agarose Scaffolds for Drug Testing. PLOS ONE. 10. e0130348. 10.1371/journal.pone.0130348.